

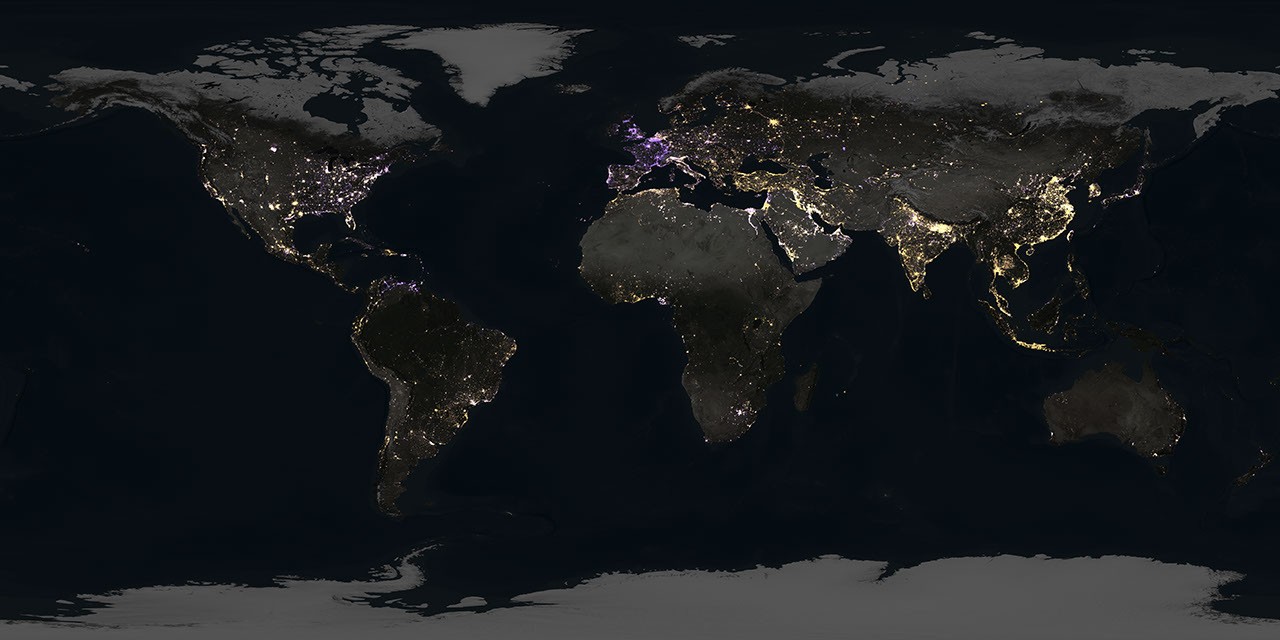
New nighttime maps based on NASA satellite imagery are upending assumptions, revealing a world where artificial brightening and dimming have intensified over the past decade. The findings show intense flaring over major oil and gas fields in the United States, while factors such as rural electrification and energy conservation are changing how billions around the world experience the night.
…
The study team, led by Tian Li and Zhe Zhu at the University of Connecticut, used a new algorithm to analyze 1.16 million satellite images collected at approximately 1:30 a.m. local time every day for nine years by the Visible Infrared Imaging Radiometer Suite (VIIRS). The refrigerator-size sensors, orbiting Earth at over 16,000 mph, can resolve light sources down to the scale of a toll booth on a dark highway. They fly aboard Earth science satellites that were launched and operated by NASA and the National Oceanic and Atmospheric Administration (NOAA).
The analysis, reported April 8 in Nature, covered most of the inhabited world, from latitudes between 60 degrees south and 70 degrees north. During the time frame analyzed—2014 to 2022—domestic production of oil and natural gas reached record levels, driven by technological developments and horizontal drilling. Satellite imagery revealed cycles of intense gas flaring over central U.S. regions, particularly the Permian Basin in Texas and North Dakota’s Bakken Formation. Flaring occurs at oil wellheads when excess gas—mostly methane—is burned off. The process releases carbon dioxide and soot, among other byproducts.
link to open access paper https://www.nature.com/articles/s41586-026-10260-w

Extended Data Fig. 3 | Global and country/territory-level temporal trends of ALAN change area and change intensity (2014–2022). a, Line plots showing the global trends in the annual area experiencing ALAN change: total change area (left); brightening change area (middle); and dimming change area (right).
b, Bivariate map classifying country/territory level trends in change areas. Countries/territories are categorized based on whether their annual area of brightening is increasing vs. decreasing, crossed with whether their annual area of dimming is increasing vs. decreasing.
c, Line plots showing the global trends in the annual ALAN change intensity: average net change intensity (left); average brightening change intensity (middle); and average dimming change intensity (right). d, Bivariate map classifying country/territory level trends in change intensity. Countries/territories are categorized based on whether their annual brightening change intensity is increasing vs. decreasing, crossed with whether their annual dimming change intensity is increasing vs decreasing.
For line plots (a,c): the dots represent the global annual ALAN change area or change intensity from 2014 to 2022, the solid lines show the overall Sen’s slope trends, and the shaded areas represent the 95% confidence interval of the estimated trends. For bivariate maps (b,d): the underlying map colours represent the combined topology of trends, the stripe texture indicates countries/territories with statistically significant trends in brightening changes (either change area or change intensity, corresponding to the panel), and the dot texture indicates countries/territories with statistically significant trends in dimming changes. Significance is determined by the Mann-Kendall test (p < 0.05) on the Sen-slope. Basemaps in b and d are adapted from the World Continents Layer from Esri.
Is it just weird light and colours on the picture, or is european lights more blue (probably LED) than the rest of the world?